Introduction to Bedside Cardiac Ultrasound
Abstract
The following write up is meant to accompany the JOMI “Introduction to Bedside Cardiac Ultrasound” video. In this video the basics regarding point-of-care cardiac ultrasound will be covered. However, knobology or physics will not be covered and are a prerequisite to the material covered in both the video and this write up.
Point of care cardiac ultrasound is a key diagnostic tool in evaluating any patient who is in extremis.1 Indications for a bedside cardiac ultrasound include cardiac arrest, unexplained hypotension, syncope, shortness of breath, chest pain, and altered mental status.2 There are no absolute contraindications for a limited bedside cardiac ultrasound. Point of care cardiac ultrasound mainly consists of four views which include the parasternal long, parasternal short, apical four chamber, and the subxiphoid, but can also include other fields such as lungs, depending on context.
General Technique
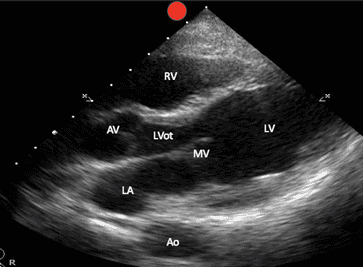
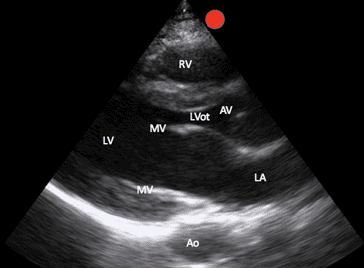
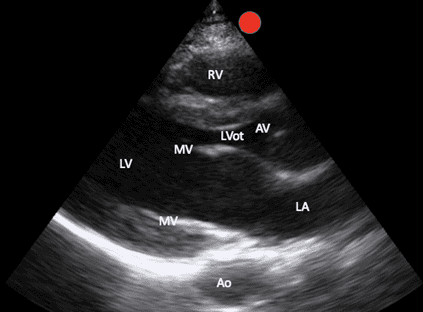
It’s important to note while conventional echocardiography uses the phased array probe with the screen indicator (visualized as a red dot on all images accompanying this manuscript) towards the patient’s left, these images may also be obtained with both the curvilinear probe and phased array probe showing the screen indicator towards the patient’s right. The later orientation simply results in a 180 degree mirror image of the conventional orientation (Image 1).
Parasternal Long Abdominal Orientation
Parasternal Long Cardiac Orientation
The conventional orientation noted above is covered here as well as in the accompanying video.
Parasternal Long View (PSL)
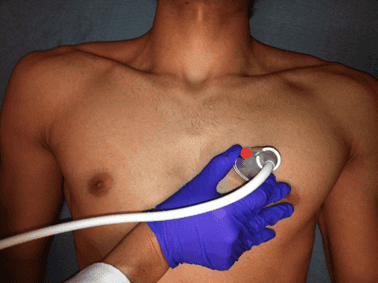
With the patient in the supine position and the probe indicator pointed towards the patient’s right shoulder, start with the probe perpendicular to the chest wall just lateral to the sternum at the second intercostal space (Image 2).
PSL Probe Position
Slowly slide downward one intercostal space at a time until the PSL cardiac window comes into view. Structures that can be identified include the right ventricle, the left ventricle, the left atrium, the mitral valve, the aortic valve, the aortic outflow tract, as well as the descending thoracic aorta (Image 3).
PSL Labeled Structures
As with all cardiac views it can be helpful to put a towel underneath the patient’s right shoulder to assist them into a more left lateral decubitus position. Doing so brings the heart more anterior to the chest wall and also allows the patient’s left lung to fall out of view via gravity. The depth should be set to allow full visualization of the entire outline of the descending thoracic aorta.
The parasternal long view allows the user to quickly identify and assess a pericardial effusion as well as gross left ventricular function. During systole, the normal structure of the fibrous and serous pericardium contains approximately 15-35mL of fluid (called a fluid flap) in between the sheets in the lower heart region.3 The evaluation of pericardial effusions uses a semi-quantitative measurement of the maximal anechoic space between the serous and fibrous pericardial sheets during diastole.3 These effusions can be separated into 3 categories: 1. Small <10mm 2. Moderate 10-20mm 3. Wide >20mm.3 Studies have shown that emergency physicians can detect a pericardial effusion using bedside cardiac ultrasound with sensitivity of 96-100% and a specificity of 98-100%.2,4 It is important to differentiate between pericardial effusions, which run anteriorly and medially to the descending aorta, versus pleural effusions which run posteriorly and laterally to the descending aorta. Pericardial effusions can cause pericardial tamponade physiology, particularly when development of the effusion is acute. Tamponade is most readily detected on bedside ultrasound by assessing for right ventricular collapse during diastole (Image 4).3
PSL with Cardiac Tamponade
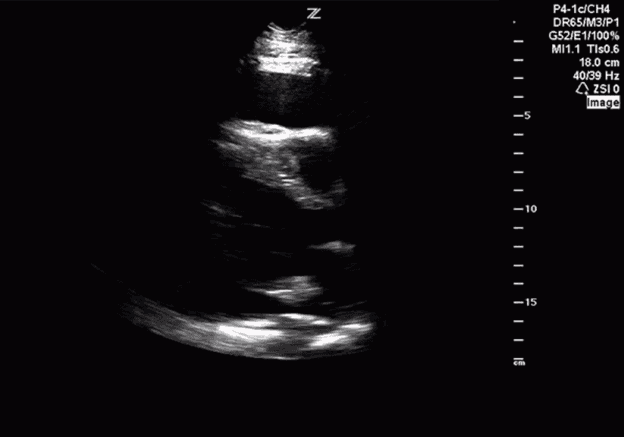
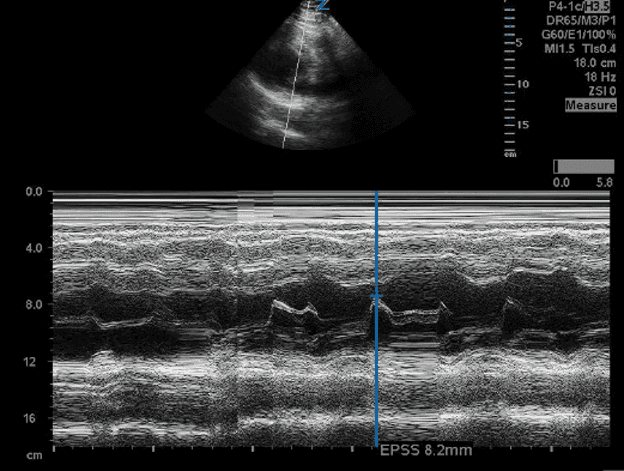
However, right atrial collapse has the best PPV if seen during all phases of the cardiac cycle.3 This diastolic collapse of the right heart is most pronounced due to the lower pressures of the right heart.3 Furthermore, tamponade can be evaluated by assessing for the left shift of the interventricular septum and plethora of the IVC.3 While qualitative assessment of ejection fraction is beyond the scope of this video, point-of-care cardiac ultrasound is useful in a qualitative assessment of global left ventricle function. Systolic function is evaluated based on a gross assessment of left ventricle volume changes as well as anterior mitral valve leaflet excursion.5 An additional objective way for evaluating left ventricular function is by using EPSS, or end point septal separation. This is where M mode is used to obtain a still image to calculate the distance between the anterior mitral valve leaflet and the septum. The farther the distance from the septum, the less the mitral valve is moving, and therefore the more the ejection fraction is reduced. A distance greater than 1 cm is consistent with reduced ejection fraction. EPSS has a specificity of 85% and a sensitivity of 82% (Image 5).6
PSL EPSS
While research evaluating the accuracy of emergency medicine providers in measuring left ventricular ejection fraction using bedside cardiac ultrasound in the ED setting is minimal, a 2017 study showed that EM residents correctly measured LVEF in the ED setting 91% of the time as compared to measurements made by a cardiologist (the gold standard).7 Moreover, in a 2007 study from Mark et al., a clinician’s ability to determine LVEF within the 3 broad categories of [Normal], [Moderately Decreased], and [Severely Decreased] has been repeatedly demonstrated and in such a way that their gross visual estimates are as accurate of those obtained using computational techniques.8 Broadly, LV ejection fraction can be further delineated into Normal LVEF >53%, Borderline LVEF 45-53%, Non-severe LVEF 35-45%, Severe LVEF <35%.9 In the parasternal long axis view, one can assess for LV dilation as well.10 LV dilation is defined as either a LV end diastolic volume of ≥ 76 mL/m2 or a diameter > 55mm when measured orthogonally to the LV wall and below the mitral valve plane.3,11
Parasternal Short View
Starting from the positioning of the parasternal long view, with your hand anchored on the patient's chest wall, rotate the probe 90 degrees with the indicator now pointing towards the patient’s left shoulder (Image 6).
PSS Probe Position

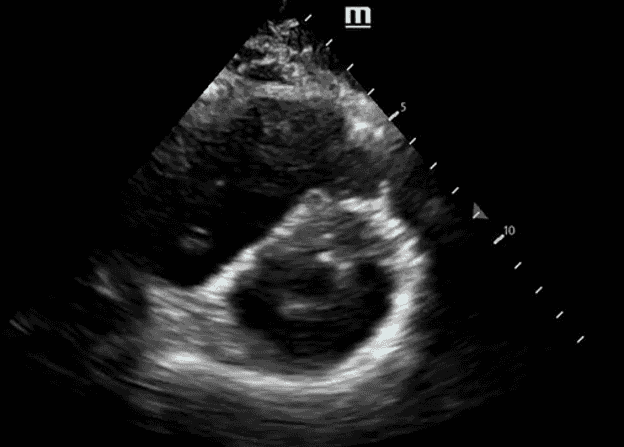
This view allows for evaluation of the left ventricle function, symmetry of squeeze and septal bowing. The left ventricle can be identified in this view and appears as a circular at the bottom right of the screen. The right ventricle appears crescent shaped and is located in the upper right part of the screen (Image 7).
PSS Labeled Structures
Fanning the probe too apically and viewing the apex of the heart rather than the papillary muscles (Image 8) will give you an incorrect assessment of left ventricular function.
Splint image PSS at Papillary Muscles and Apex
* Papillary Muscle View
Apical PSS view
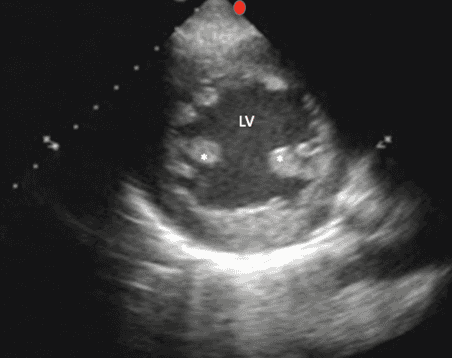
As with the parasternal long, the parasternal short view can be used to evaluate global systolic function and assess for pericardial effusions. This view is particularly useful for identifying increased right ventricle pressures which manifests as interventricular septal flattening or septal bowing (Image 9).
Septal Flattening, also known as a “D” sign
Studies show emergency medicine providers can detect RV pressure overload, wall motion abnormalities and pericardial effusions with 100% accuracy as compared to the gold standard.7 Unfortunately, RV overload on echocardiography has low specificity and thus poor diagnostic accuracy for diagnosing PE, indeed those patients with normal heart function who have pulmonary embolism have been shown to not have RV failure.3,12 However, for those patients who are hemodynamically unstable, exclusion of pulmonary embolism can be inferred by the lack of signs of right ventricular failure.3, 13
Apical Four Chamber
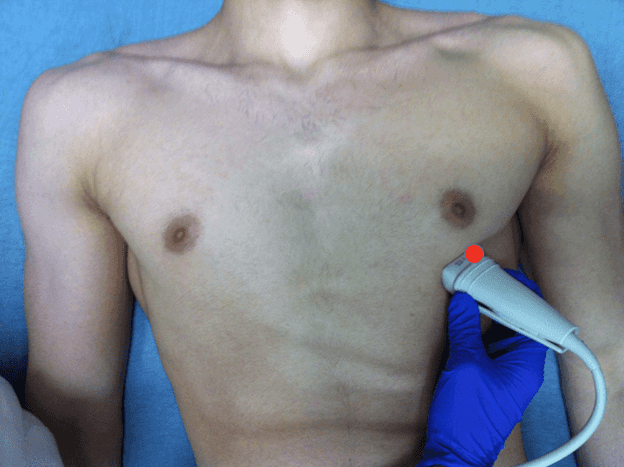
For this view, place the indicator to the patient’s left side and put the probe at the patient’s point of maximal impulse. In men, this is often inferior and lateral to the nipple; in women it’s often at the inframammary crease. Angle the probe cephalad towards the base of the heart (Image 10).
Apical 4 Chamber Probe Position
This view allows for visualization of the left atrium, the mitral valve, the left ventricle, the right atrium, the tricuspid valve and the right ventricle Image 11).
Apical Four Chamber Labeled Structures
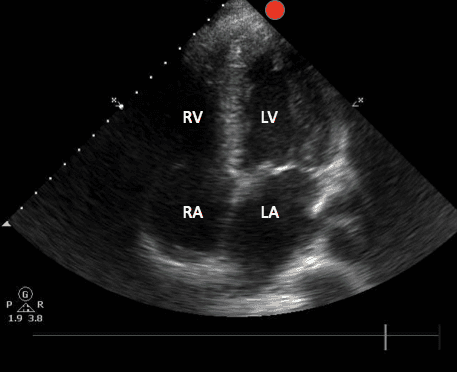
This view is the most challenging view and patient positioning is critical. The left lateral decubitus is the best position to optimize this view In addition to some of the pathology discussed in prior views, the apical four chamber view allows for comparison of right and left ventricle sizes. A normal right to left ventricle ratio is 0.6:1. This view is particularly useful for assessing right ventricular hypertrophy, increased right ventricular pressures, and McConnell’s sign. McConnell’s sign describes a distinct echocardiographic finding of right ventricular dysfunction involving akinesia of the mid-free wall of the right ventricle combined with normal apical motion. The original study by McConnel et al suggests this finding has a sensitivity of 77% and a specificity of 94% for diagnosing PE.14 However, more recent studies demonstrated McConnell’s sign has been seen in other examples of cardiopulmonary pathology, including right ventricular infarction, ARDS, and pulmonary hypertension, and thus has a much lower specificity (30%) for PE.15 Studies have shown McConnell’s sign to have a positive predictive value of between 40-57% for suspected pulmonary embolism.16 Overall, this ultrasound finding alone should not be used to diagnose PE.
Subxiphoid / Subcostal
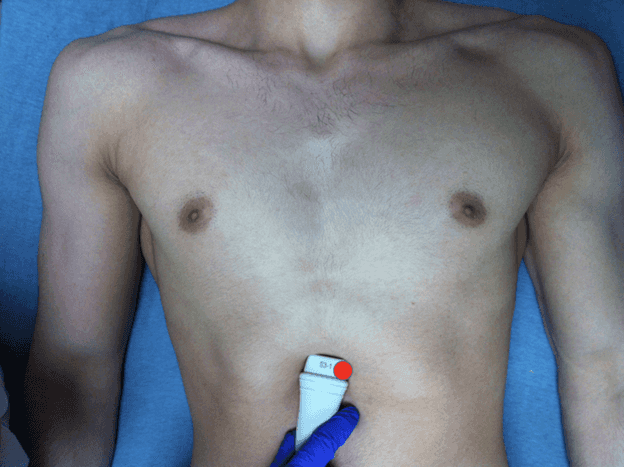
For this view, either the phased array probe or the curvilinear probe can be used. For the subxiphoid in the formal echocardiographic orientation the probe indicator points towards the patient’s left side. Start by finding the subxiphoid process.Place the porbe inferior and to the right of the patient’s xiphoid process. Apply downward pressure while angling cephalad and towards the patient's left shoulder (Image 12).
Subxiphoid Probe Position
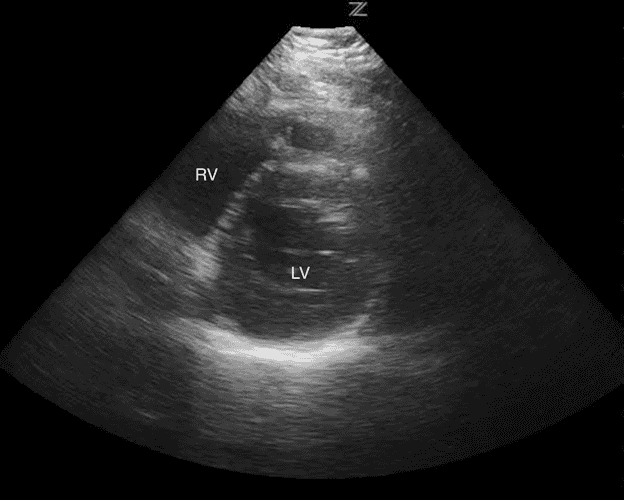
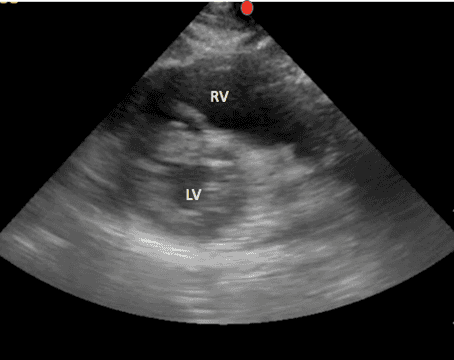
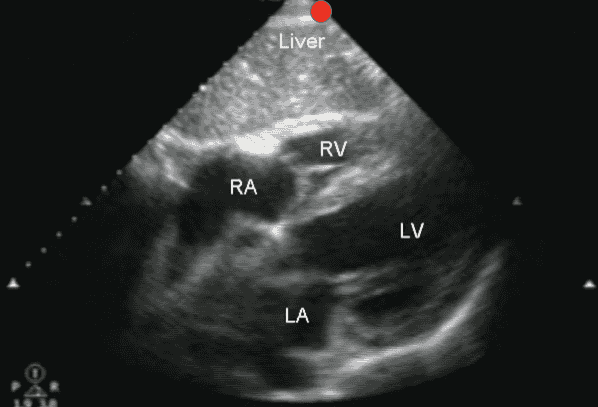
Use the liver as an acoustic window to enhance the image. The top of the screen will show the patient's liver. Immediately inferior to the liver will be the patient’s right ventricle and below this one can identify the left ventricle. Depending on the angle, one may also be able to visualize the right and left atrium in this view as well (Image 13).
Subxiphoid Labeled Structures
Getting the subxiphoid view can be difficult for numerous reasons. These include patient body habitus, bowel gas, free air in the thoracoabdominal area, or the patient’s inability to tolerate the exam secondary to pain.
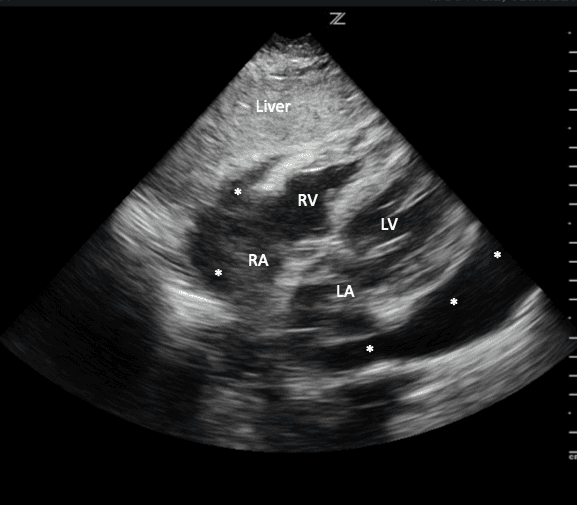
The subxiphoid view is the best view to assess for the presence or absence of a pericardial effusion.2,17,18 Fluid from a pericardial effusion initially accumulates in the most dependent portions of the pericardium, namely the inferior and posterior aspects, usually around the right atrium.19,20 Volumes as small as 15-35cc of fluid in the pericardium can be detected using bedside cardiac ultrasound.21 If a pericardial effusion is present, on a subxiphoid view you will see fluid between the liver lobe and the right ventricle at the top of your screen (Image 14).
Subxiphoid with Pericardial Effusion
*** where pericardial effusion is present
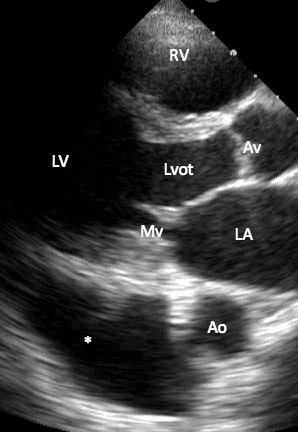
As there is no pleural reflection between the liver and the heart, the subxiphoid view is particularly useful in helping to distinguish between a pericardial and a pleural effusion but it can also be visualized in the parasternal long view (Image 15).22,23
PSL with Pleural Effusion
*** where pleural effusion is present
Multiple studies report sensitivities and specificities as high as 96-100% for identifying a pericardial effusion using cardiac ultrasound.4, 13, 18, 24
Citations
- Goett HJ, Tews M. Introduction to Bedside Ultrasound. Clerkship Directors in Emergency Medicine; Society for Academic Emergency Medicine (SAEM). Copyright 2021.
- American College of Emergency Physicians. (2016). Policy Statement. Ultrasound Guidelines: Emergency, Point-of-Care and Clinical Ultrasound Guidelines in Medicine. Ann Emerg Med. 2017;69(5):e27–e54. doi:10.1016/j.annemergmed.2016.08.457.
- Zanza C, Longhitano Y, Artico M, et al. Bedside cardiac pocus in emergency setting: a practice review. Rev Recent Clin Trials. 2020;15(4):269–277. doi:10.2174/1574887115666200802023306.
- Mandavia DP, Hoffner RJ, Mahaney K, Henderson SO. Bedside echocardiography by emergency physicians. Ann Emerg Med. 2001 Oct;38(4):377–82. doi:10.1067/mem.2001.118224.
- Mitchell C, Rahko PS, Blauwet LA, et al. Guidelines for performing a comprehensive transthoracic echocardiographic examination in adults: recommendations from the american society of echocardiography. J Am Soc Echocardiogr. 2019;32(1):1–64. doi:10.1016/j.echo.2018.06.004.
- Ahmadpour H, Shah AA, Allen JW, Edmiston WA, Kim SJ, Haywood LJ. Mitral E point septal separation: a reliable index of left ventricular performance in coronary artery disease. Am Heart J. 1983 Jul;106(1):21–8. doi:10.1016/0002-8703(83)90433-7.
- Farsi D, Hajsadeghi S, Hajighanbari MJ, et al. Focused cardiac ultrasound (FOCUS) by emergency medicine residents in patients with suspected cardiovascular disease. J Ultrasound. 2017 Jun;20(2):133–138. doi:10.1007/s40477-017-0246-5.
- Mark DG, Ku BS, Carr BG, et al. Directed bedside transthoracic echocardiography: preferred cardiac window for left ventricular ejection fraction estimation in critically ill patients. Am J Emerg Med. 2007;25(8):894–900. doi:10.1016/j.ajem.2007.01.023.
- Potter E, Marwick TH. Assessment of left ventricular function by echocardiography: the case for routinely adding global longitudinal strain to ejection fraction. JACC Cardiovasc Imaging. 2018;11(2 Pt 1):260–274. doi:10.1016/j.jcmg.2017.11.017.
- Lang RM, Bierig M, Devereux RB, et al. Recommendations for chamber quantification. Eur J Echocardiogr. 2006;7(2):79–108. doi:10.1016/j.euje.2005.12.014.
- Galderisi M, Santoro A, Versiero M, et al. Improved cardiovascular diagnostic accuracy by pocket size imaging device in non-cardiologic outpatients: the NaUSiCa (Naples ultrasound stethoscope in cardiology) study. Cardiovasc Ultrasound. 2010;8:51. doi:10.1186/1476-7120-8-51.
- Roy PM, Colombet I, Durieux P, Chatellier G, Sors H, Meyer G. Systematic review and meta-analysis of strategies for the diagnosis of suspected pulmonary embolism. BMJ. 2005;331(7511):259. doi:10.1136/bmj.331.7511.259.
- Tayal VS, Kline JA. Emergency echocardiography to detect pericardial effusion in patients in PEA and near-PEA states. Resuscitation. 2003;59(3):315–318. doi:10.1016/s0300-9572(03)00245-4.
- McConnell MV, Solomon SD, Rayan ME, Come PC, Goldhaber SZ. Regional right ventricular dysfunction detected by echocardiography in acute pulmonary embolism. American Journal of Cardiology. 1996 Aug;78(4):469–473. doi:10.1016/s0002-9149(96)00339-6.
- Casazza F, Bongarzoni A, Capozi A, Agostoni O. Regional right ventricular dysfunction in acute pulmonary embolism and right ventricular infarction. Eur J Echocardiogr. 2005;6(1):11–14. doi:10.1016/j.euje.2004.06.002.
- Vaid U, Singer E, Marhefka GD, Kraft WK, Baram M. Poor positive predictive value of McConnell's sign on transthoracic echocardiography for the diagnosis of acute pulmonary embolism. Hosp Pract. 2013 Aug;41(3):23–7. doi:10.3810/hp.2013.08.1065.
- Adler Y, Charron P. The 2015 ESC guidelines for the diagnosis and management of pericardial diseases. European Heart Journal. 2015 Nov;36(42)2873–2885. doi:10.1093/eurheartj/ehv479.
- Labovitz AJ, Noble VE, Bierig M, et al. Focused cardiac ultrasound in the emergent setting: a consensus statement of the American Society of Echocardiography and American College of Emergency Physicians. J Am Soc Echo. 2010 Dec;23(12):1225–30. doi:10.1016/j.echo.2010.10.005.
- Goodman A, Perera P, Mailhot T, Mandavia D. The role of bedside ultrasound in the diagnosis of pericardial effusion and cardiac tamponade. Journal of Emergencies, Trauma, and Shock. 2012;5(1):72–75. doi:10.4103/0974-2700.93118.
- Imazio M, Adler Y. Management of pericardial effusion. European Heart Journal. 2013;34(16):1186–1197. doi:10.1093/eurheartj/ehs372.
- Ceriani E, Cogliati C. Update on bedside ultrasound diagnosis of pericardial effusion. Intern Emerg Med. 2016;11(3).477–80 doi:10.1007/s11739-015-1372-8.
- Tang A, Euerle B. Emergency department ultrasound and echocardiography. Emerg Med Clin North Am. 2005;23(4):1179–94. doi:10.1016/j.emc.2005.07.015.
- Weekes AJ, Quirke DP. Emergency echocardiography. Emerg Med Clin North Am. 2011;29(4):759–87. doi:10.1016/j.emc.2011.08.002.
- Haddad F, Doyle R, Murphy DJ, Hunt SA. Right ventricular function in cardiovascular disease, part II: pathophysiology, clinical importance, and management of right ventricular failure. Circulation. 2008;117(13):1717–1731. doi:10.1161/circulationaha.107.653584.


| Publication Date | 7/7/2022 |
| Article ID | 322 |
| Production ID | 0322 |
| Volume | 2022 |
| Issue | 322 |
| DOI | |
| https://doi.org/10.24296/jomi/322 | |